


Claude and other AI models have been transforming the work done in the civic technology space. These models are now being used to launch new websites, apps, and data-driven tools that connect to open data and enhance or replace insufficient government platforms. Using these AI tools has allowed members of the civic tech community to take building state capacity into their own hands by setting up their own digital public service platforms and sharing newfound insights and visualizations of public data.
Some notable examples:
Daniel Golliher of Maximum New York has built out an entire data hub exploring new ways to visualize and understand government, and highlighted other uses here
Josh Greenman of Vital City has launched dozens of apps like NYPD CompStat ledger that organizes and visualizes NYC crime data in real-time
Nathan Storey of NYC OTI has built Civic AI Tools to make working with NYC Open Data easier and more effective
Sean Eke of CBC created Hearing Hearings, which summarizes NY City Council hearings from YouTube transcripts & NY City Council Legistar information
While AI tools still have many limitations and should be used with guardrails, with their outputs always checked and verified, ignoring them only limits one’s own potential today.1
In this post, I want to showcase several ways I have used AI tools to contribute to the civic technology domain myself. I will cover how I use AI to enhance and inform my Substack writing, to conduct policy research and understand government systems better, and to build tools for the public like with Block Party.2
If you have an AI use case or civic tech tool you have created, please share it with me! I will add it to the AI Civic Tech Tools Wiki on my website, and feature it in future posts. If you want to learn more about how to use/build these tools, or connect with others building in this space, please also reach out to me to connect or simply to register your interest. I am in the works with several other civic tech builders to plan some events and establish a working group for AI/policy — look out for more to come soon.
AI for Substack Writing and Open Data Exploration
Perhaps the most direct impact of AI on my own work has been its complete integration into my data exploration and visuals-making process. Previously, when digging into the data behind a policy topic, I would manually comb through dozens of online pages, spend hours tracking down data sources, and even longer on putting together tables or charts that could shed insights on the issues I was writing on.
Today, I let AI do much of this tracking down and visual creation. That is not to say I don’t still spend much time googling and reading about various data sets and contexts. But I will ask Claude to help me find relevant sources, or provide it with several sources I have found and ask it to find me others that are similar or provide different perspectives. This has both sped up my research process and deepened it by surfacing links that I would not have found otherwise.
Similarly, once I have a good idea of a visual I want to produce based on my findings and the message I want to convey, I’ll ask Claude to put it together. I may suggest an exact chart type and details I want it to use, or I’ll just give Claude a description of what I want and iterate on whatever it comes up with.
Here are several examples of the visuals I’ve created for Substack posts:
Table of NYC Chief Savings Officers budget savings items, scraped from a Mayor’s Office announcement text list
Loading bar breakdown of NYC curb space allocation across the entire city
Treemap of the NYC FY2025 budget, broken down by agency and color-coded by domain
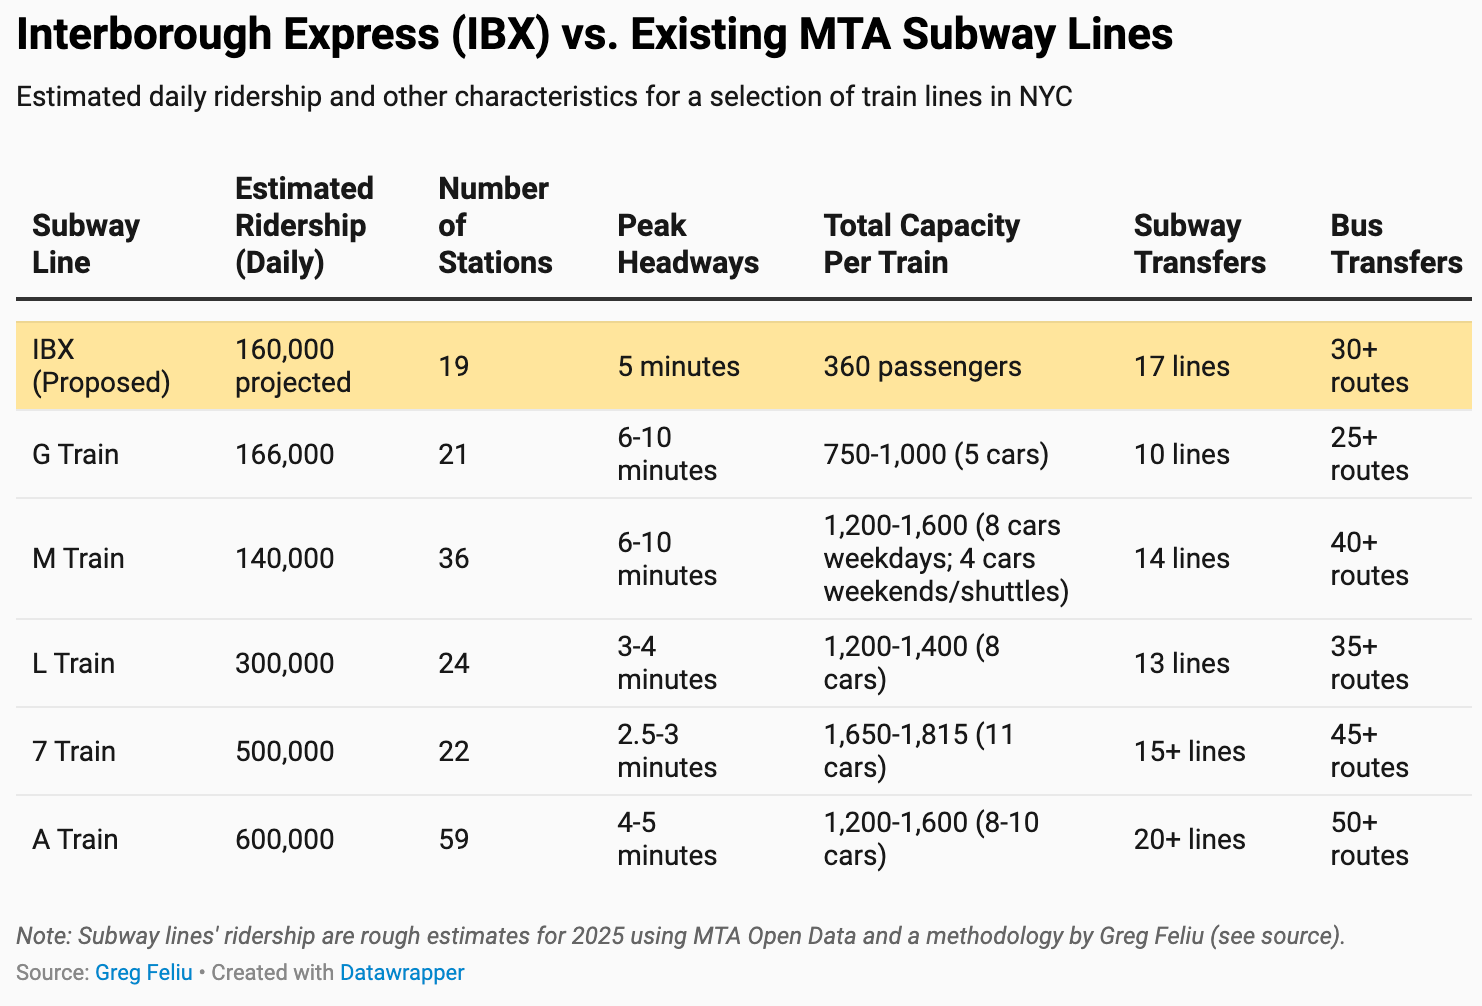
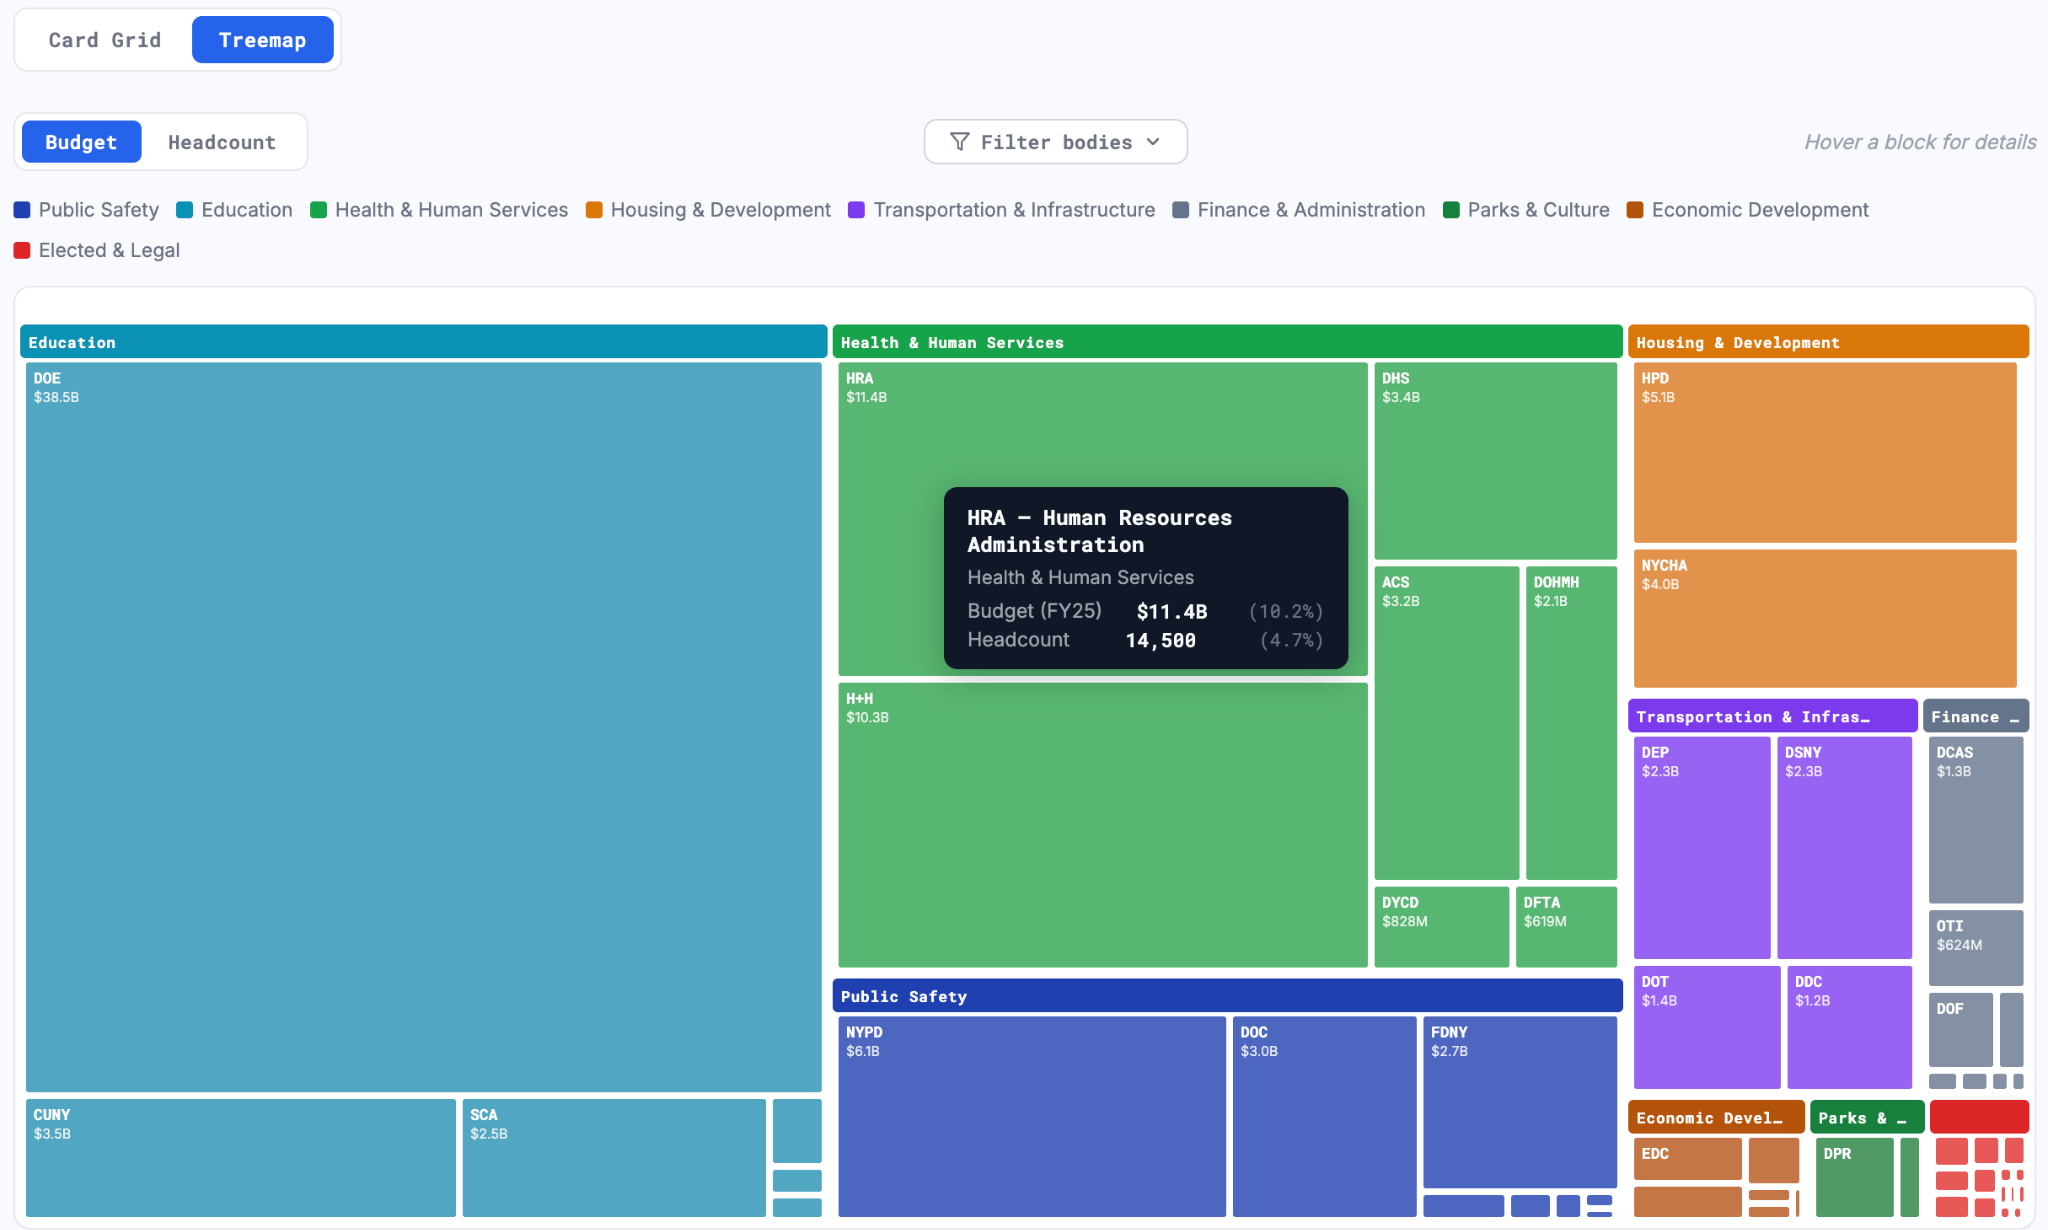
One huge upgrade to my chart-making thanks to AI has been the ability to make these visuals interactive. While I was previously making static charts in R (ggplot2) or tables with Datawrapper that had minimal interactivity, web-hosted visuals made by Claude have much more dynamic elements. For any visual I create, I can ask Claude to make it sortable, filterable, shift what element the visual is highlighting or sizing by, or completely recalculate the chart based on a user selection.
Some tips to improve the visual-making process:
Set up a skill, or at least a markdown document accessible to Claude, with instructions on how you like your charts to look and preferred chart types or methodologies for certain types of data. This can also work in the negative, like instructing Claude to never create pie charts for budget data (or whatever else you would like).
Create a visualization style guide that matches your personal preferred style from everything like color schemes to fonts to how legends or footnotes should be formatted. Anytime Claude keeps formatting visuals in a way you don’t like, add new instructions to this guide so it avoids doing so in the future.
Tell Claude to provide all sources used in its visual and explain all methodology for any calculations or transformations done.
Ask Claude to make charts interactive if possible, including image download/embed links and links to download/view the data source.
On that last point, if you want to enable AI to do the same for you, you’ll have to set-up a pipeline so Claude has somewhere to host your data, charts, and methodology pages. Otherwise all these files can only be locally hosted and you won’t have a way to make these visuals/datasets publicly accessible or easily shareable.
My set-up has involved linking Claude Code to my personal Github, setting up rules for which repos or folders it should push new code for new posts/visuals to, and then pushing new visuals and anything hosted on the web to their own GitHub Page. Once you’ve got that type of workflow set, you can have Claude directly push new pages or make changes to existing pages that will nearly instantly update on a live, publicly accessible webpage. You can even use Github Actions to automate regular updates or data pushes, along with much more.
Tips for hosting AI-created visuals on custom webpages:
The first step is to set up the GitHub CLI for Claude Code (or whatever model you are running on your computer) – ask Claude to walk you through how to do this!
Ask Claude to create a website and store it locally, telling it what data to use, such as an open dataset name or whatever local files you have. You can also then make edits locally, before pushing changes to GitHub to update your website/pages.
Use Namecheap or another domain hosting service to create a new CNAME record (DNS settings) that points to your newly created GitHub website/page.
Anytime you make a change to one of your website pages, can always ask Claude to launch a local server to show you the updates; after reviewing changes on the localhost page, tell Claude to push those changes and that’s all you should need to do for updates to go live!
For extra credit, you can purchase your own domain and create custom subdomains with whatever names you wish. I use Namecheap to do this but there are many cheap options. You can then link your GitHub Pages to these customized domain names, so that your AI-created webpages have fun or clean names like:
nycuriosity.com | data.nycuriosity.com | talroded.nycuriosity.com
I realize that not all the above steps are intuitive for those without prior GitHub or website development experience. If you are interested in setting up your own websites, data portals, interactive charts, or any of the above, feel free to reach out to me! And remember that Claude itself can be an instrumental partner in setting up these work processes to begin with.
Building the Block Party Community Board Resolutions Knowledge Base
I recently wrote about a new tool I partnered with the Block Party team to build, the NYC Community Boards resolutions knowledge base. You can read more about what this tool is and how it can help inform users about community board discussions and actions here.
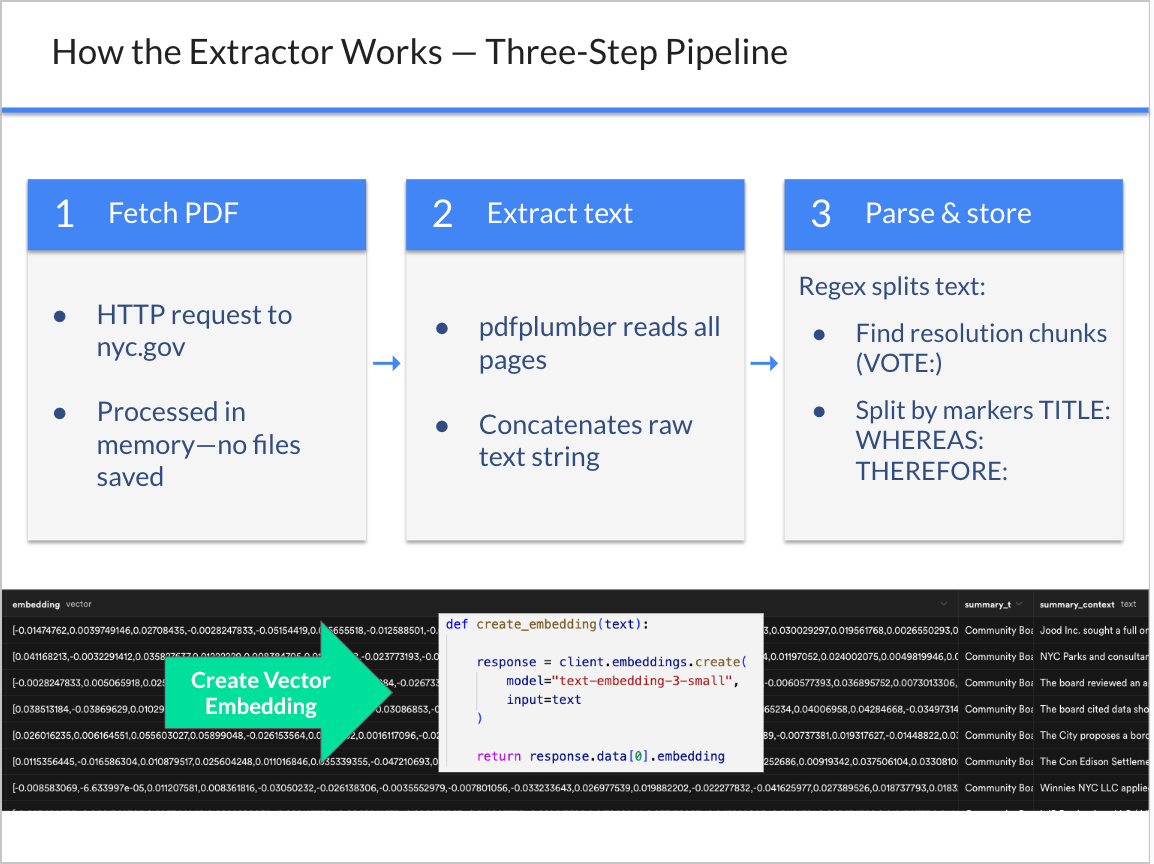
The process to construct this resolutions database currently involves fetching the meeting notes PDF from its URL, extracting all the raw text, then using a number of rules to identify the relevant resolution text and parse it out from the full PDF. The text is then lightly cleaned and stored in different context chunks related to whether the resolution text is the title, a whereas clause (which gives background on the resolution topic), or a therefore clause (which states the action/decision the CB is making with the resolution).
To build this resolutions extractor, I conducted an iterative approach with Claude Code writing the majority of the Python code in every step. In many instances, I spoke to Claude in plain-language, describing to it what I wanted to do (“create an automatic pdf extractor that downloads every meeting notes available on the Manhattan CB3 website”) and then reviewing its code. I was then able to give Claude feedback on the pipeline it set-up, and iterate to improve how text was extracted or chunked, again all as if I was talking to a colleague.
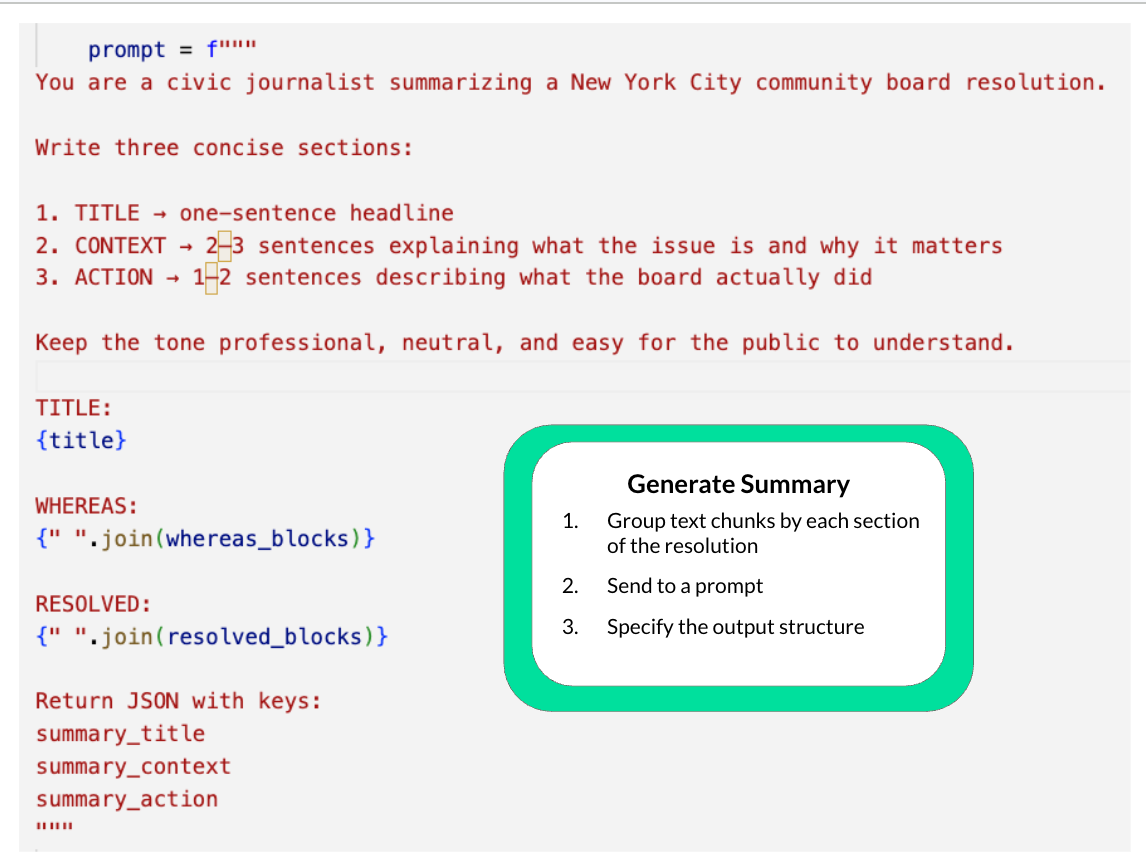
My collaborator on this work, Sarah Sachs, also used AI to help us generate AI summaries of resolutions. In her case, she took the text chunks I uploaded and ran them through an OpenAI model called in a Python script, with a simple prompt asking the model to summarize each text chunk for each resolution. This prompt is by no means perfect or in a final state for our own purposes, but it’s incredible how effective the model was at providing concise and informative summaries based on such simple plain instructions.


Explore the Community Board resolutions and transcripts databases here.
The result is a centralized, searchable database of community board resolutions that returns both the full resolution text and 2-3 sentence summaries that convey the main takeaways. Community Board members, the public, journalists, and any other interested party can stay better informed on the decisions being made by Community Boards or search for the full history of CB resolutions on any topic or keyword.
The most exciting part is that our work on Block Party has just begun, and we are currently working on scaling up the tool. Again using AI to enable our workflow, we are scaling the resolutions knowledge base to include all Community Boards posting their meeting notes or resolutions publicly, and adding new features to enable exploring and understanding the text better.
AI tools made it possible to create the first ever database of this kind for NYC Community Boards that can improve democratic participation and awareness of local issues, built by a small team in just a few months.
AI is transforming the civic technology field. Let’s transform it together.
Key to all the AI use cases in this post are two things:
I always check Claude’s work for any visual it creates and any data it presents. This includes making sure calculations are performed correctly, data sources exist and are being accessed and manipulated properly, and that claimed figures match up with reality (where possible to verify) or expectations (where not).3
I never use Claude to generate my opinions or do my writing. While I find it an amazing researcher and visual-maker, I personally do not want to automate the actual analysis and synthesis of the data insights process. You may hold different views, but this is the part I find most essential to keep guarded from automation.
The examples shared above are also just two narrow slices of the multitude of applications for the suite of AI tools currently out there. They are by no means the only use cases for AI, nor even close to the frontier of what current models and tools can accomplish.
To give just a few more examples:
I created a “NYC Government Bodies Explorer” that lets you organize and visualize the size of NYC agencies, commissions, and other types of government bodies by headcount or budget. This was all built on publicly available data that Claude Code scraped.
For that matter, the Data Hub itself that I host these visuals and all the charts and tables for my Substack posts was built and is constantly updated by Claude.
My personal website is also built using Claude, which further auto-updates my Writings tab when I make new posts and builds the Wiki page with all its resources based on a pile of links I continue to throw at it without structure.
Henry Grunzweig created the State Capacity Ecosystem map that makes it simple to find organizations working on state capacity problems. I created an interactive version of this map, using AI to build it, here.
I highly encourage anyone interested in covering public policy or having a meaningful impact on policies to experiment with AI and learn how to use and build tools themselves. As I mentioned above, if you wish to share a use case or tool of your own, please share it with me (by Substack DM, in the comments of this post, email, or anywhere else) and I will both add it to my AI Civic Tech Tools wiki and feature it in a future Substack post.
Further, I’m planning some events with other civic tech practitioners to grow the state capacity and civic tech ecosystem in NYC. Look out for announcements soon on hackathon-style events and mixers where people with policy interests can come together to build and explore these tools. And if you’re interested in getting involved, please reach out to one of us.
For a particularly thoughtful critique of using AI to code and build, see this Substack post. AI models are not solve-everything miracle tools. But used purposefully and thoughtfully, they can present tremendous upside.
Claude Code has been my primary bread and butter, so I will mostly be referring to Claude Code (or just Claude) below, but you can reliably insert your own preferred AI model/tool with the same capabilities
In cases where the dataset is too large to manually examine, I will spot check Claude’s results and note on the methodology page that the visual displays results generated by AI and should be manually verified.